AI Competitor Insight Tool
3rd place at the Danfoss AI Hackathon. Give it a product, and it finds competitors' equivalents, reads their datasheets and shows where the product is ahead or behind.
| Status | Completed3rd place, Danfoss AI Hackathon |
|---|---|
| Dates | Oct 2025 |
| Stack | PythonOpenAI APIReact |
| Links |
|
| Page updated |
The problem
Comparing a product with its competition usually means finding the competitors' equivalent products, reading their datasheets and lining up the specifications by hand. It is slow, easy to get wrong, and covers only as many products as someone has time for. At the Danfoss AI Hackathon we had 72 hours to build a tool that does this work with AI.
What I built
A pipeline that takes a product and benchmarks it against its direct competitors, in four steps:
- Find: an AI-driven scraper searches competitors' websites for PDFs of products similar to the given one.
- Extract: a precise prompt to the OpenAI API turns each datasheet into one JSON file per product.
- Normalize: attribute names are unified and values rewritten into consistent types, so the same specification from two manufacturers ends up in the same field.
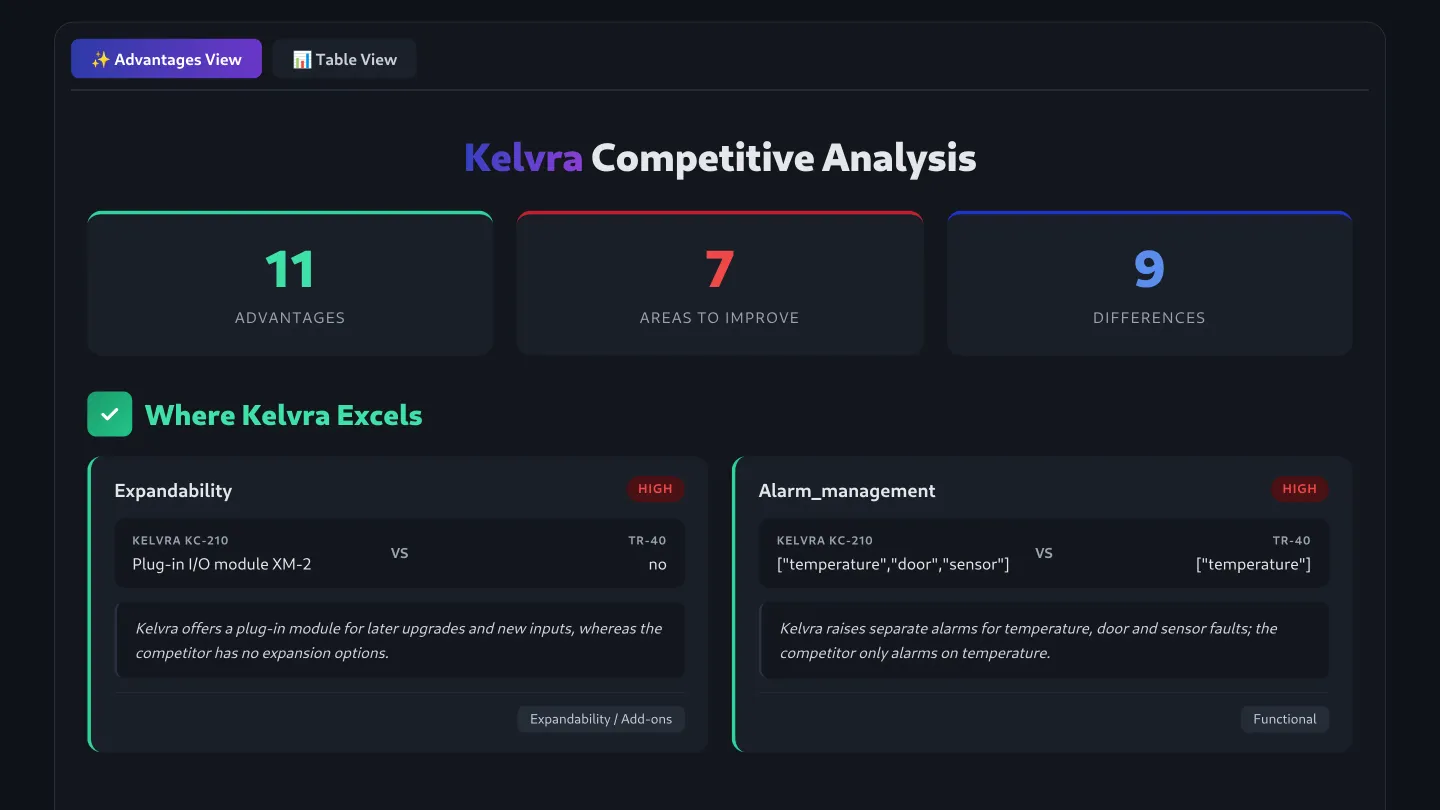
- Compare: the normalized products go into one benchmark table that shows the similarities and the differences, and where the product is ahead or behind.
The pipeline is written in Python; the benchmark table is shown in a React front end.
Key decisions
- One JSON file per product, from a strict prompt. Every later step depends on the extraction having the same shape every time. The hardest part of the hackathon was writing prompts that stayed reliable across very different PDF layouts.
- Normalize before comparing. Two datasheets rarely name or format the same specification the same way. Without a separate normalization step, the comparison would mostly find naming differences, not product differences.
- A table as the output. The benchmark ends as one table that is easy to read and compare, not a report to interpret.
Result
3rd place at the Danfoss AI Hackathon.
In our pitch we estimated about 5 hours of manual work per product against about 15 minutes with the pipeline, and around 100 products a day instead of about 10. Those are estimates from the hackathon, not measurements.
A note on what is shown here
The code and the real dashboard are not public. The image above recreates the dashboard's layout with an invented brand, products and values, so it shows what the tool produced without showing real data.
More projects
- Live
Previous project
Kilodash
A car instrument cluster that runs in the browser, driven by a simulated car with tested driver-assist logic.
Stack: TypeScript (strict)React 18ViteCanvas 2DVitestPlaywrightGitHub Actions
Next project
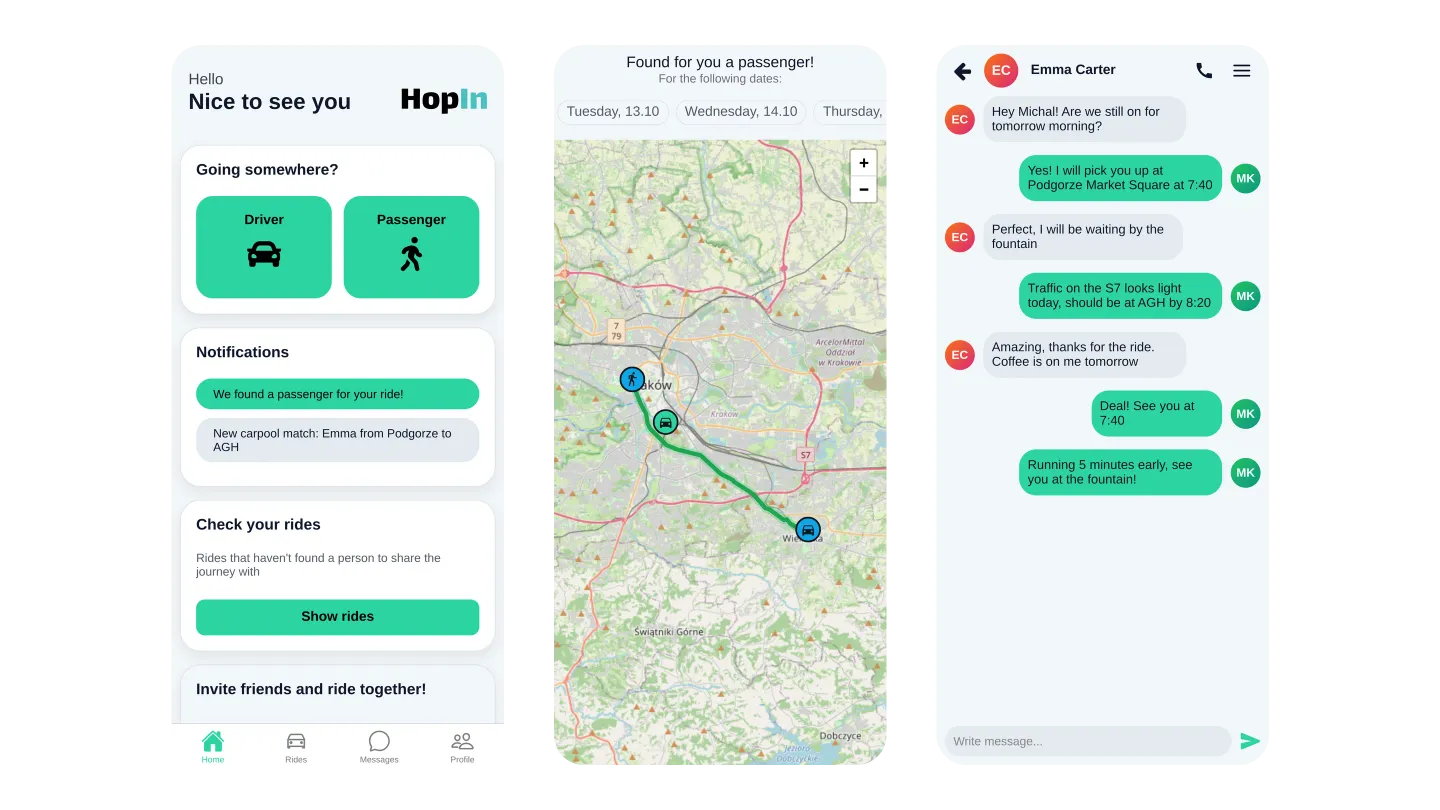
HopIn
A carpooling app for people going the same way. Drivers add their route, passengers join, and the app counts the cars and CO2 that sharing saves. Built in two weeks.
- No public code
Stack: React NativeExpoNode.jsGoogle Maps API